
How to Measure Whether AI Is Actually Paying Off
The AI receptionist is answering every call. So why aren’t there more jobs on the board?
Implementing AI or automation is only the beginning. The next question is whether it is actually improving the business — and whether that improvement justifies the investment.
A system can be technically functional and still underperform commercially. Calls may be answered but not converted. Leads may enter a CRM but receive weak follow-up. Response times may improve while customers encounter new friction. You or your team may save time in one part of a process only to spend it correcting problems elsewhere. This is where calibration matters. Once a system is operating, the focus should shift from implementation to performance: measure what changed, understand why, and adjust accordingly. The objective is not simply to have automation working.
It is to make the business work better.
Start with the baseline
Improvement is difficult to demonstrate without knowing where you started.
A baseline is simply the “before” measure. Record how the process performs now, using the metric most relevant to the problem, then compare it with performance after the change. For missed calls, that may mean total incoming calls and the percentage unanswered. For lead handling, it might include lead volume, response time, follow-up and conversion. For administrative automation, the baseline could be hours spent completing a recurring task, errors requiring correction or the number of manual steps involved. The measure should therefore follow the objective. Without that connection, it is easy to measure activity without knowing whether the business has actually improved.
Step 1: Find your baseline
What are missed calls costing you right now?
Every number is a starting guess. Change it to yours.
A · Missed calls
Not sure? Check your phone’s missed calls for last week. Real numbers beat guesses.
B · Phone admin
Answering calls, call-backs, writing down job details, sending texts and emails.
Your estimate. Answering, taking details and confirmation texts can usually be handed off. Call-backs to quote often stay with you.
A · Missed calls
Today: $0 a year lost
0 jobs a year · 0 a month
With an AI receptionistevery call answered:
+$0 a year won back
B · Phone admin
Today: 0 h a week
≈ $0 a year of your time
With an AI receptionist0 h back a week:
+$0 a year saved
Total value a year
$0
Phone calls only. Slow replies to web forms, DMs and emails cost you more on top. Job value is revenue, before your costs.
How we worked this out
- Jobs lost a year = missed calls a week × 48 working weeks × 80% who hang up without leaving a message × your conversion rate.
- Lost (and won back) a year = jobs lost × your average job value. Once every call is answered, those callers convert at your normal rate.
- Admin time a year = hours a week × 48 weeks × what your hour’s worth. Saved = that × the share you hand off.
- The hand-off share is your estimate. 50% is a starting point, not a measured figure. Set your own, then check your real hours after a month.
- AI receptionist sellers often claim 70–80% of routine enquiries are handled automatically, but these are figures from vendor websites, without published methods.
- The best independent benchmark, McKinsey (2023), estimates today’s technology could automate tasks taking 60–70% of employees’ time. That is the technical potential across all jobs, not proven savings in a trade business.
- 50% sits deliberately below both.
- Conservative by design: a 48-week year, and the 20% of callers who do leave a message aren’t counted.
- Trade defaults are starting guesses based on published Australian rates. Use your own numbers.
Sources: 411 Locals call study (2024): only 37.8% of calls to small businesses reached a live person · Voicemail research: around 80% of callers hang up without leaving a message · Oldroyd & Elkington, MIT/InsideSales (2007) and HBR (2011): responding within 5 minutes makes qualifying a lead 21× more likely than waiting 30 · McKinsey, The economic potential of generative AI (2023) · What’s The Damage, Australian Tradie Pricing 2026.
Follow the customer journey
One of the simplest ways to assess performance is to follow what happens from the moment an opportunity enters the business.
For many service businesses, that begins with a phone call. If 20% of calls were previously unanswered and that falls to 5% after introducing a new system, that is a clear operational win. For example, a plumber taking 60 calls a week, that is nine more calls answered every week!
But what happened to the calls that were captured?
Were they qualified? Did the customer receive the information they needed? Was an appointment made? Was there follow-up? Did the lead eventually convert? A useful sequence is:
Lead → Response → Next step → Conversion → Value
Leads may arrive through phone, website, social media, Google Business Profile, paid advertising, email, referral or another channel. Tracking the source can also reveal patterns hidden by an overall conversion figure. Telephone enquiries may convert strongly while social leads rarely progress. Website enquiries may be plentiful but suffer from slow after-hours response. The purpose is not to collect more data. It is to identify where value is being gained — and where it is still being lost.
Response time matters, but not on its own
Faster response is often one of the most visible benefits of automation. Moving from a three-hour average response time to 15 minutes represents a 91.7 per cent reduction in response time. That is meaningful. But speed alone is not enough if the interaction becomes less useful. A fast response that misunderstands the enquiry, sends the customer into the wrong workflow or creates more work for you or your team has not necessarily improved the process.
Response time therefore works best alongside other measures such as:
· missed-call rate
· leads successfully captured
· appointments or next actions completed
· manual intervention required
· lead conversion
· recurring customer confusion or complaints
Together, these provide a more realistic picture than speed alone.
Conversion shows whether opportunities are progressing
Lead conversion helps distinguish lead generation from lead handling. Consider a simple example.
Before: 100 leads → 20 conversions · Conversion rate: 20%
After: 100 leads → 27 conversions · Conversion rate: 27%
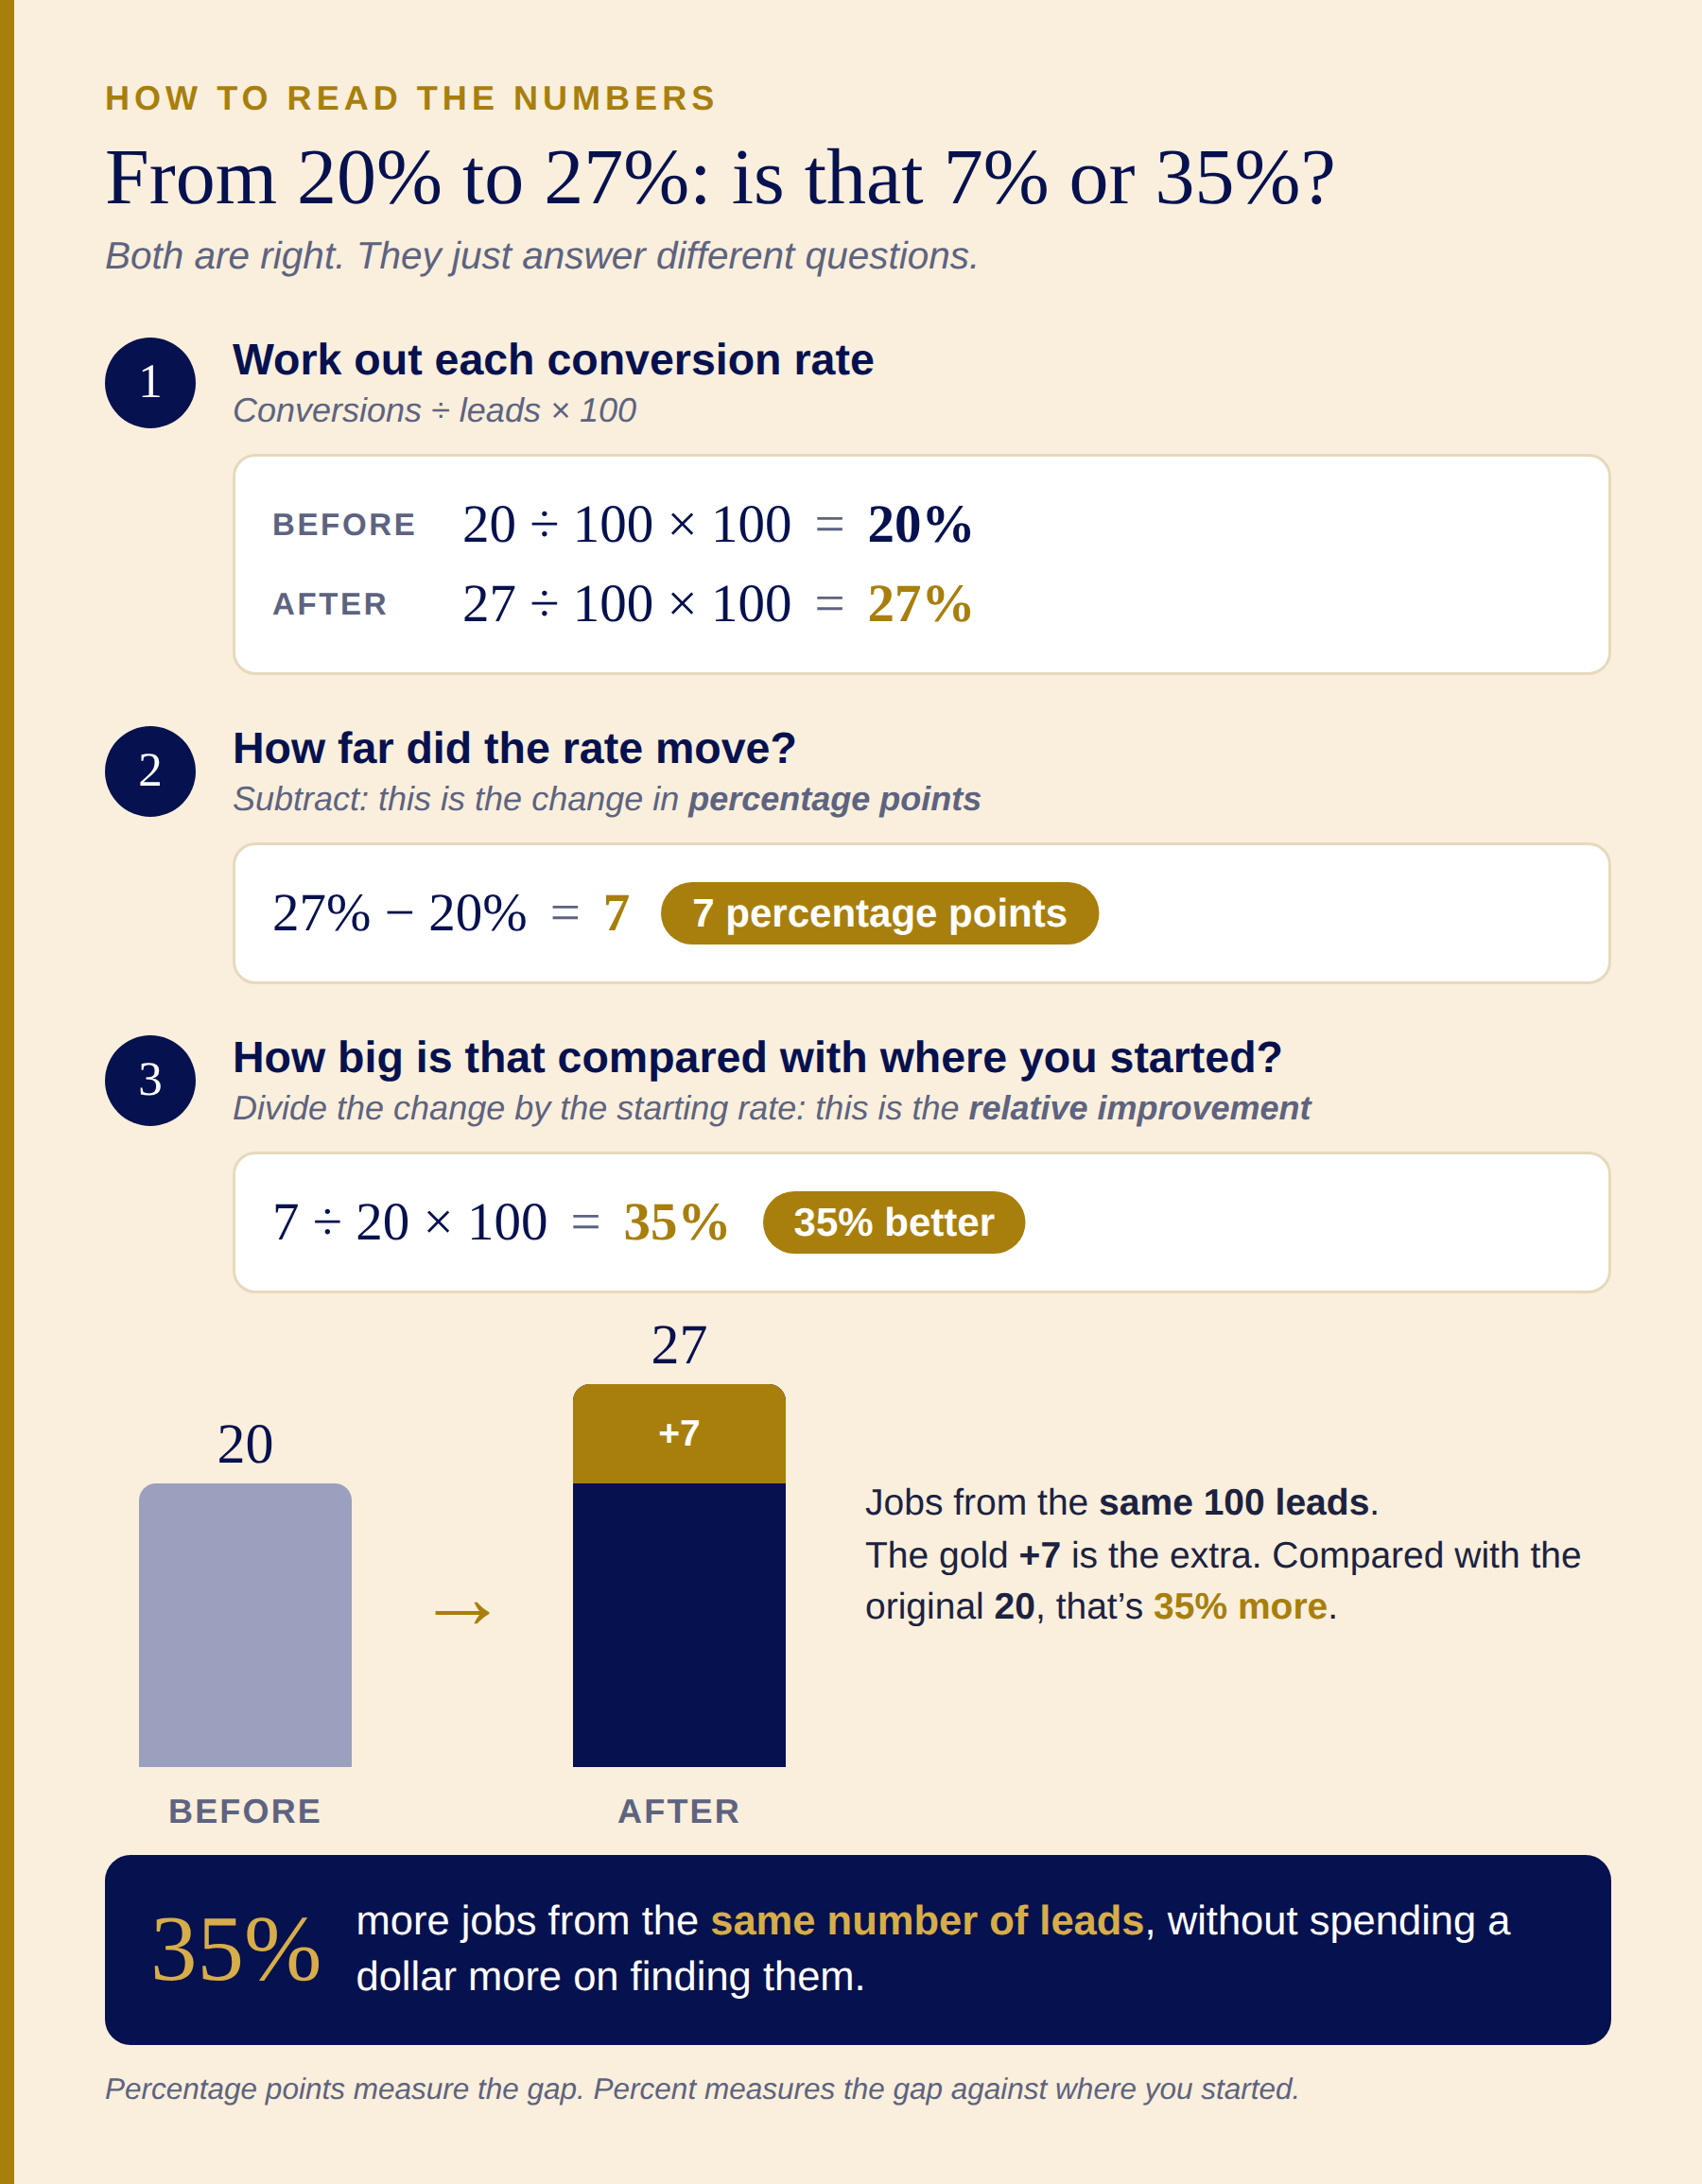
Percentage points measure the gap. Percent measures the gap against where you started.
The business has produced seven additional conversions from the same number of opportunities. That is a 7 percentage-point increase, or a 35 per cent relative improvement on the original conversion rate. This distinction becomes even more important when lead volume changes.
If the business later receives 150 leads, simply comparing total sales before and after can be misleading. Some growth may have come from generating more opportunities rather than handling those opportunities better.
So two questions should be separated:
· Are we generating more opportunities?
· Are we converting the opportunities we already have more effectively?
Both matter. They describe different forms of improvement.
Then connect performance to value
Operational measures tell you whether something changed.
ROI asks whether the change was worth paying for.
At its simplest:
ROI = (Value gained − Cost of investment) ÷ Cost of investment × 100
The harder question is deciding what belongs under “value gained”. Revenue is the obvious measure, but value may also come from:
· additional conversions
· fewer missed opportunities
· staff time recovered
· reduced administration
· reduced rework or errors
· more time for paid work
The important point is not to claim financial value that cannot reasonably be connected to the change. If a business gains ten additional conversions and knows an average conversion is worth $300, the relationship is relatively straightforward. For our plumber, ten extra jobs at $450 each is $4,500 in revenue that can be traced directly to the change.
If you or a team member saves three hours each week, there are two honest ways to value it.
The first is cost:
Three hours of labour at $50 an hour is $150 a week, or about $7,200 over a 48-week year.
The second is opportunity:
If those hours go back on the tools, the same three hours billed at $120 an hour, a conservative rate for Perth plumbers, are worth $360 a week, or about $17,280 over the same 48-week year.
But the second figure only counts if the time is actually used that way. Three hours saved is capacity recovered. It only becomes revenue when it's put to work. Good ROI analysis should stay grounded in what can actually be demonstrated.
Why AI ROI is still difficult to prove
This is not only a small-business issue. McKinsey noted in April 2026 that many organisations still struggle to measure how well their AI investments are performing. Its framework places financial impact at the top of the measurement hierarchy, including revenue uplift, cost reduction, margin improvement and total cost of ownership. ¹
Gartner reported in July 2026 that customer-service organisations were leading AI adoption while clear financial returns remained difficult to establish. Separate Gartner research found that only 24 per cent of surveyed service and support leaders demonstrated positive financial returns across their AI use cases (a survey of 1,303 leaders, January–April 2026). ²
The underlying lesson is simple.
Technology can create activity, convenience and productivity without necessarily producing enough commercial value.
That is why measurement should not stop at whether the technology works.
Calibration means finding out why
When the expected result does not appear, it does not automatically mean the technology has failed. The system may simply need adjustment. Perhaps response is fast, but qualification is poor. Perhaps calls are being answered but customers are not being moved towards the right next step. Perhaps automation is handling too much and needs an earlier human handover. Perhaps leads enter the system correctly but follow-up stops too soon. Or maybe you or your team are working around the system because it doesn’t fit how you actually work. It could even be that the business is measuring the wrong thing.
This is where performance data becomes useful. It changes the question from: “Is the AI working?” to: “Where is the process performing well, where is value being lost, and what should we adjust?” Keep, adjust, expand — or remove.
Calibration also means accepting that not every automation should remain unchanged. Once enough information has been collected, there are four practical options.
Keep it if the process is producing the intended result.
Adjust it if the underlying idea is sound but performance can improve.
Expand it once value has been demonstrated and there is a logical next application.
Remove it if the cost, complexity or customer friction outweighs the benefit.
Removing an automation can be as smart a decision as adding one. The goal is never maximum automation. It is better performance. From implementation to optimisation
A simple calibration cycle is:
Measure → Compare → Diagnose → Adjust → Review
Measure performance against the baseline.
Compare it with the original objective.
Diagnose where value is still being lost.
Adjust what is necessary.
Then review again.
At Nauven, this is the natural step after assessment and implementation. Technology should not simply be installed and left to run. It should be calibrated against what the business was trying to achieve in the first place. Sometimes the improvement will be obvious. Sometimes several small adjustments will be needed. Sometimes the numbers will show that a particular automation does not produce enough value to justify continuing with it. Each result is useful. It tells you whether to keep, adjust or remove.
Successful AI is not defined by how sophisticated the technology appears.
For businesses wanting a more cost-effective start, a simple turnkey tool that does one job well, such as answering every call, can meet the core need without a major or custom build. Even then, minor calibrations along the way are not completely unexpected.
Either way, success is defined by whether the business can show that something meaningful became better — and whether the value of that improvement stands up against what it cost to achieve.

Sources
¹ J-T Lorenz, J Cherian Abraham, R Levin & D Ziman, ‘From promise to impact: How companies can measure—and realize the full value of AI’, McKinsey & Company, 24 April 2026.
² Gartner, ‘Customer Service Leads on AI Adoption but ROI Remains Elusive’, 13 July 2026; Gartner, ‘Gartner Survey Finds Customers Are 3x More Likely to Use Third-Party GenAI Than Company-Provided Chatbots for Customer Service’, 8 July 2026 (source of the 24 per cent figure).